Communications in Plant Sciences, vol 9, p. 100-107, 2019 (2019017)
DOI: http://dx.doi.org/10.26814/cps2019017
Nitrogen and potassium sources of fertilizers may affect wheat blast and Fusarium head blight under favorable weather conditions
Sérgio Ricardo Silva*, Adriano Augusto de Paiva Custódio, José Salvador Simonetto Foloni and Manoel Carlos Bassoi
*Correspondence to: sergio.ricardo@embrapa.br
Abstract: Wheat blast (WB) and Fusarium head blight (FHB) are important wheat spike diseases in South America. There is evidence that the severity of these diseases is influenced by soil fertilization. The effects of nitrogen (N) and potassium (K) sources of fertilizers and phenological stages for topdressing fertilization on these spike diseases were evaluated during the 2015 and 2016 winter seasons in an endemic area for these diseases in Brazil. Two distinct field experiments were carried out, one focusing on N sources and the other on K sources. The experimental design was a complete randomized blocks, with four replicates, and the treatments were disposed in a 2 x 3 x 3 factorial: two wheat genotypes (BRS Gaivota and BRS Gralha-Azul), three sources of N or K, and three phenological stages for fertilization. The WB and FHB severities in BRS Gralha-Azul were higher than that in BRS Gaivota. FHB severity was lower when N was applied in the booting stage than in flowering. The sources of K influenced FHB severity, which was higher when K chloride was applied, compared with K nitrate. The weather condition was the determining factor in the wheat expression to WB and FHB diseases, followed by genotype resistance.
Highlighted Conclusions
1. Nitrogen and K sources of fertilizers and the phenological stages for N and K fertilizations do not play a significant role on wheat expression to WB and FHB.
2. Weather condition is the determining factor in the wheat expression to WB and FHB, followed by genotype resistance.
Keywords: Triticum aestivum, Magnaporthe oryzae Triticum pathotype, Fusarium graminearum, Wheat spike diseases, Nutrient-plant disease interaction.

INTRODUCTION
Wheat blast (WB) and Fusarium head blight (FHB) are considered the two main wheat spike diseases, which could result in harmful impact on yield and grain quality (Del Ponte et al. 2017). These two diseases have been found to simultaneously attack spikes in some South American wheat production regions, when there are favorable weather conditions for pathogen and disease (Del Ponte et al. 2017, Ha et al. 2016).
The WB, caused by the hemibiotrophic fungus Magnaporthe oryzae Triticum (MoT) pathotype (anamorph: Pyricularia oryzae), was discovered in Northern Paraná State, Brazil, in 1985 (Igarashi et al. 1986). It has caused damages in wheat crop in subtropical and tropical regions, particularly in South America (Brazil and Bolivia), where sporadic disease outbreaks have taken place under warmer and wet conditions (Cruz and Valent 2017, Maciel 2011).
The FHB is caused by members of the FHB species complex, which comprises more than 16 species, highlighting Fusarium graminearum Schwabe [teleomorph: Gibberella zeae (Schwein.) Petch]. This pathogen produces mycotoxins that cause quality and yield grain reductions, as well as human and animal health risks (Yoshida et al. 2008, Krnjaja et al. 2015, van der Lee et al. 2015, Ha et al. 2016, Dweba et al. 2017).
Effective management of WB and FHB cannot be accomplished through the use of a single control strategy (Blandino et al. 2012, Pagani et al. 2014, Krnjaja et al. 2015, Wegulo et al. 2015, Dweba et al. 2017). Therefore, it is imperative to employ an integrated management program that uses several combinations of disease control, including genetic (host plant resistance), chemical (fungicides), biological (microbial antagonists), and agronomic (cultural practices). The management of nutrients can be included as a very important agronomic practice, because the severity of these diseases can be modified by plant nutritional status (Hofer et al. 2016, Rodrigues et al. 2017, Silva et al. 2019).
Nitrogen (N) and potassium (K) are key nutrients for wheat crop, considering a suitable cost-benefit ratio (Robertson and Vitousek 2009, Marschner 2012). There are many sources of N and K that can be used in agriculture. The main N commercial fertilizers used are urea, ammonium sulfate, calcium nitrate, and ammonium nitrate; and the main K commercial fertilizers are potassium chloride, potassium sulphate, and potassium nitrate, since they are soluble for easy uptake and assimilation by crops (Hirel et al. 2011, Zörb et al. 2014, Cao et al. 2018). Currently, there is uncertainty among farmers regarding the management of N and K fertilization, mainly on the agronomic efficiency of the different sources of nutrients, and on the most appropriate plant phenological stage to apply them.
The increase in N fertilization over the past few decades has been a major component in increasing crop yield (Kant et al. 2011). However, such fertilizer use has conflicting effects on plant-pathogen interactions. N input can improve plant defense mechanisms and, at the same time, can increase the availability of N organic and inorganic compounds for exploitation by pathogens, enhancing disease development (Tavernier et al. 2007, Veresoglou et al. 2013, Mur et al. 2016). In this context, Yang et al. (2010) reviewing several studies carried out in Canada, concluded that the amount and source of N fertilizer can affect the incidence and severity of FHB. There is evidence that N form can influence WB. Osuna-Canizalez et al. (1991) verified that rice plant given NO3– were more susceptible to blast disease on leaf than plants receiving NH4+.
Due to its crucial functions in a number of physiological processes, such as enzyme activation, photosynthesis, turgor generation, primary metabolism, and long-distance transport of photosynthates, K plays a fundamental role in crop resistance to abiotic and biotic stresses, such as drought, salinity, high light or cold, pests and pathogens (Zörb et al. 2014). Several studies showed a positive effect of K supply on pathogen resistance, but in some cases, the opposite was true or it had no effect (Amtmann et al. 2008, Wang et al. 2013). Variable effects of K on disease incidence can be affected by plant and pathogen species, as well as by the amount and source of K (Wang et al. 2013).
The objective of this research was to evaluate the effects of N and K sources of fertilizers and phenological stages for topdressing fertilization on WB and FHB severities and grain yield of wheat genotypes, considering two crop seasons with different weather conditions in a subtropical region of Brazil.
MATERIAL AND METHODS
Study site and experimental design. The field experiments were carried out in Londrina (23º11’37” S, 51º11’03” W; altitude of 628 m), Paraná State, Brazil, replicated in two crop seasons (2015 e 2016) under natural wheat disease pressure. The experimental area was managed with monocultures of soybean in summer and wheat in winter under a no-till system, at least for 10 crop seasons before the beginning of the study. The climate of the region is humid subtropical (Cfa, according to the Köppen classification), with annual average temperature of 21 °C. The annual precipitation is 1651 mm, with January being the wettest month (217 mm), and August the driest (60 mm). Frosts are infrequent and there is no dry season defined. The soil is classified as Rhodic Eutrudox (Eutroferric Red Latosol, in the Brazilian classification, according to Santos et al. 2013), with 710 g kg-1 clay, 82 g kg-1 silt, and 208 g kg-1 sand. Some soil chemical properties (0-0.2 m): organic carbon = 15.3 g dm-3; pH (CaCl2) = 5.2; available phosphorus and potassium (Mehlich-3 extractant) = 35.7 and 228 mg dm-3, respectively; exchangeable calcium, magnesium and aluminum (KCl 1N extractant) = 4.00, 2.26 and 0.01 cmolc dm-3, respectively; total acidity at pH 7.0 (H + Al) = 4.7 cmolc dm-3. Daily meteorological variables (precipitation, relative humidity and mean temperature) used in this experiment are from a meteorological station located 500 m away from the field trial.
Two independent experiments were performed in the same research area 50 m apart: i) N fertilizer sources versus WB and FHB diseases; ii) K fertilizer sources versus WB and FHB diseases. The experimental design was a complete randomized blocks, with four replicates, and the treatments were disposed in a 2 x 3 x 3 factorial: two commercial wheat (Triticum aestivum L.) genotypes (BRS Gaivota and BRS Gralha-Azul), three sources of the nutrients (for N: calcium nitrate, ammonium sulfate, and ammonium nitrate; or for K: potassium nitrate, potassium sulphate, and potassium chloride), and three phenological stages for topdressing fertilization [100% on booting (Z41 stage; Zadoks et al. 1974), 100% on flowering (Z61 stage; Zadoks et al. 1974)], and 50% on booting + 50% on flowering). The topdressing fertilization treatments were 60 kg ha-1 N or 60 kg ha-1 K2O in the first and second experiments, respectively. The basal fertilization, along with wheat sowing, consisted of applying 30 kg ha-1 P2O5 together with 30 kg ha-1 K2O or 30 kg ha-1 N, in the first or second experiments, respectively. Additionally, 40 kg ha-1 N were applied in topdressing only in the second experiment, simultaneously with K treatments. In relation to the reaction to WB, BRS Gaivota is classified as resistant, and BRS Gralha-Azul as susceptible (Bassoi et al. 2016). Concerning to the reaction to FHB both genotypes are classified as moderately susceptible (Bassoi et al. 2016). The phenological stages for topdressing fertilization (booting and flowering) were chosen to intensify the effects of the nutrients on WB and FHB. This is particularly important because wheat is susceptible to infections between full spike emergence (WB) or anthesis (FHB) to early stages (medium milk-to-dough stage) of grain development (Goswami and Kistler 2004, Cruz and Valent 2017).
The plots contained nine rows, 6.0 m in length, spaced 0.2 m apart (10.8 m2), and the seeding density was regulated to obtain about 300 plants per square meter. The sowing dates of the trials were April 16th and April 13th in 2015 and 2016 crop seasons, respectively. The control of weeds, insects and foliar diseases (before heading) were performed in accordance with regional technical indications for wheat crop (Cunha and Caierão 2014). However, WB and FHB were not controlled by means of fungicide or other techniques.
Disease assessments and plant measurements. In each plot, WB severity on spikes was visually estimated in laboratory, supported by a diagrammatic scale (Maciel et al. 2013). Only spikes showing disease typical symptoms formed by bleaching above of the dark lesions in the rachis were evaluated. A destructive sampling method was used to collect at least 60 spikes from two central wheat rows of 0.5 m long, selected at random inside each plot, when the plants were at dough stage development (Z80 stage; Zadoks et al. 1974). Blast severity was recorded as the average proportion of diseased spikelets per spike, divided by total number of spikes sampled, including those with zero severity (Paul et at. 2005). FHB severity was evaluated in the same spike samples using a visual scale for spring wheat (Stack and McMullen 1995).
Yield was estimated by harvesting wheat plants at maturity at 5 m in length of seven center rows from each plot and recording the grain weight after adjusting the moisture content to 13%.
Statistical analysis. The experimental data for each crop season (2015 and 2016), individually, were analyzed by the GENES® statistical packages (Cruz 2013). For an analysis of the models assumptions were performed Lilliefors’ test for normality, and Bartlett’s test for homogeneity of variance. Skewness and kurtosis coefficients were also evaluated. According to these tests, no data transformation was needed. Since all assumptions required for analysis of variance (ANOVA) were met, the F-test was performed. When the ANOVA resulted in a significant p value (p ≤0.05) the Tukey’s test (p ≥0.05) was used for multiple comparisons of the treatments means, for grain yield, WB and FHB severities, considering the unfolding of the interactions between the experimental factors.
RESULTS
Experiment 1: N sources of fertilizers. There was WB severity only in 2015 crop season, with an average of 19% (Table 1). Among the experimental factors studied, significant effect on WB was observed only for genotypes. WB severity in BRS Gralha-Azul was 60% higher than in BRS Gaivota. This finding confirms the breeder’s rating (Bassoi et al. 2016) concerning to the reaction of these genotypes to WB.
In turn, FHB severity was verified only in 2016, which was considered a crop season with low disease pressure, since the overall average severity was about 0.41% (Table 1). The phenological stages for topdressing N fertilization influenced FHB severity. When applied in the booting stage, FHB severity was about one-third of the other treatments. The other experimental factors (sources of N and genotypes) did not affect FHB severity.
Wheat grain yield was on average 7% higher in the genotype BRS Gralha-Azul compared to BRS Gaivota, despite the former was more affected by WB (Table 1). Grain yield was about 50% higher in 2016 crop season than to 2015, which can be attributed to the association of WB and weather condition effects.
Table 1. Analysis of variance (mean square) of wheat grain yield, blast severity and Fusarium head blight severity of two genotypes (BRS Gaivota and BRS Gralha-Azul) in the crop seasons of 2015 and 2016 in Londrina, Paraná (Brazil), in response to three nitrogen (N) sources (calcium nitrate, ammonium sulfate, and ammonium nitrate), applied in topdressing in three phenological stages (100% on booting, 100% on flowering, and 50% on booting + 50% on flowering)
| Source of variation | Dfa | Mean square | |||||||||||||
| Grain yield | Blast severity | Fusarium head blight severity | |||||||||||||
| 2015 | 2016 | 2015 | 2016c | 2015c | 2016 | ||||||||||
| Block | 3 | 193273 | 1721033 | 42.9 | – | – | 0.1027 | ||||||||
| Genotype (G) | 1 | 763943 | ** | 1453117 | *** | 1059.3 | *** | – | – | 0.0154 | ns | ||||
| Source of N (S) | 2 | 229695 | ns | 57511 | ns | 20.3 | ns | – | – | 0.0419 | ns | ||||
| Phen. stage (P) | 2 | 27026 | ns | 266670 | ns | 36.4 | ns | – | – | 1.0179 | *** | ||||
| G x S | 2 | 73841 | ns | 262805 | ns | 37.4 | ns | – | – | 0.1909 | ns | ||||
| G x P | 2 | 20422 | ns | 53389 | ns | 83.1 | ns | – | – | 0.0893 | ns | ||||
| S x P | 4 | 167520 | ns | 32308 | ns | 17.8 | ns | – | – | 0.0960 | ns | ||||
| G x S x P | 4 | 172005 | ns | 99948 | ns | 16.1 | ns | – | – | 0.0810 | ns | ||||
| Error | 51 | 86623 | 100749 | 33.6 | – | – | 0.1083 | ||||||||
| CVb (%) | 9.1 | 6,6 | 30.4 | – | – | 81.3 | |||||||||
| Factor | Treatment | Grain yield (kg ha-1) | Blast severity (%) | Fusarium head blight severity (%) | |||||||||||
| 2015 | 2016 | 2015 | 2016c | 2015c | 2016 | ||||||||||
| Genotype (G) | BRS Gaivota | 3121 | b | 4688 | b | 14.7 | b | 0 | 0 | 0.39 | a | ||||
| BRS Gralha-Azul | 3359 | a | 4973 | a | 23.5 | a | 0 | 0 | 0.42 | a | |||||
| Phen. stage (P) | Booting | 3243 | a | 4946 | a | 17.6 | a | 0 | 0 | 0.18 | b | ||||
| Flowering | 3200 | a | 4740 | a | 19.1 | a | 0 | 0 | 0.58 | a | |||||
| Boot.+Flower. | 3278 | a | 4805 | a | 20.5 | a | 0 | 0 | 0.45 | a | |||||
adf = degrees of freedom. bCV = coefficient of variation. cThere was no wheat blast and Fusarium head blight in 2015 and 2016 crop seasons, respectively. ns,*,** and *** = no significant, and significant at the p ≤0.05, 0.01 and 0.001, respectively, by F-test. Within crop season and factor (genotype or phenological stage), means followed by the same letter are not significantly different at p >0.05 according to Tukey’s test.
Experiment 2: K sources of fertilizers. The WB severity ─which took place only in 2015 crop season─ was about one fourth higher in the BRS Gralha-Azul genotype than in BRS Gaivota (Table 2). Influences of the phenological stages for topdressing K fertilization and sources of K on WB severity were not verified in this study.
Table 2. Analysis of variance (mean square) of wheat grain yield, blast severity and Fusarium head blight severity of two genotypes (BRS Gaivota and BRS Gralha-Azul) in the crop seasons of 2015 and 2016 in Londrina, Paraná (Brazil), in response to three potassium (K) sources (potassium nitrate, potassium sulphate, and potassium chloride), applied in topdressing in three phenological stages (100% on booting, 100% on flowering, and 50% on booting + 50% on flowering)
| Source of
variation |
df a | Mean square | |||||||||||||||||
| Grain yield | Blast severity | Fusarium head blight severity | |||||||||||||||||
| 2015 | 2016 | 2015 | 2016c | 2015c | 2016 | ||||||||||||||
| Block | 3 | 195210 | 505331 | 45.5 | – | – | 1.6402 | ||||||||||||
| Genotype (G) | 1 | 3430669 | *** | 13251610 | *** | 88.9 | ** | – | – | 3.6582 | *** | ||||||||
| Source of K (S) | 2 | 2348 | ns | 74830 | ns | 2.9 | ns | – | – | 1.1955 | ** | ||||||||
| Phen. stage (P) | 2 | 45180 | ns | 68990 | ns | 0.6 | ns | – | – | 0.1076 | ns | ||||||||
| G x S | 2 | 26068 | ns | 27487 | ns | 19.1 | ns | – | – | 0.5296 | ns | ||||||||
| G x P | 2 | 16631 | ns | 504628 | ns | 5.0 | ns | – | – | 0.1725 | ns | ||||||||
| S x P | 4 | 35450 | ns | 204791 | ns | 6.6 | ns | – | – | 0.2407 | ns | ||||||||
| G x S x P | 4 | 42678 | ns | 219193 | ns | 9.3 | ns | – | – | 0.0562 | ns | ||||||||
| Error | 51 | 39220 | 142412 | 11.2 | – | – | 0.2093 | ||||||||||||
| CVb (%) | 5.8 | 8.5 | 36.3 | – | – | 80.5 | |||||||||||||
| Factor | Treatment | Grain yield (kg ha-1) | Blast severity (%) | Fusarium head blight severity (%) | |||||||||||||||
| 2015 | 2016 | 2015 | 2016c | 2015c | 2016 | ||||||||||||||
| Genotype (G) | BRS Gaivota | 3177 | b | 3992 | b | 8.1 | b | 0 | 0 | 0.34 | b | ||||||||
| BRS Gralha-Azul | 3614 | a | 4850 | a | 10.3 | a | 0 | 0 | 0.79 | a | |||||||||
| Source of K (S) | K nitrate | 3392 | a | 4357 | a | 9.6 | a | 0 | 0 | 0.32 | b | ||||||||
| K sulphate | 3406 | a | 4442 | a | 8.9 | a | 0 | 0 | 0.63 | ab | |||||||||
| K chloride | 3388 | a | 4463 | a | 9.2 | a | 0 | 0 | 0.75 | a | |||||||||
adf = degrees of freedom. bCV = coefficient of variation. cThere was no wheat blast and Fusarium head blight in 2015 and 2016 crop seasons, respectively. ns,*,** and *** = no significant, and significant at the p ≤0.05, 0.01 and 0.001, respectively, by F-test. Within crop season and factor (genotype or source of K), means followed by the same letter are not significantly different at p >0.05 according to Tukey’s test.
FHB severity was null in 2015 crop season, and it was in low disease pressure in 2016 with an average of 0.57% (Table 2). BRS Gaivota genotype was significantly more tolerant to FHB, since it had about a half of disease severity than BRS Gralha-Azul. Sources of K also influenced FHB severity, which was higher when K chloride was applied in topdressing fertilization, compared with K nitrate (Table 2).
Grain yield was not affected by K sources neither by the phenological stages in which K was applied in topdressing fertilization (Table 2). However, the effect of genotype factor was verified, since BRS Gralha-Azul had grain yield increases of 14 and 22% in the crop seasons of 2015 and 2016, respectively, when compared to BRS Gaivota.
DISCUSSION
Nitrogen and K sources of fertilizers influencing WB and FHB. The N and K sources of fertilizers did not affect WB severity. Therefore, the chemical compounds of N (NO3– or NH4+) and the accompanying ions of N (Ca2+ or SO42-) and K (NO3–, SO42- or Cl–) in the fertilizers had no influence on this disease in these field studies.
FHB severity was influenced by K sources of fertilizer. When the accompanying anion was Cl– there was an increase of severity of 0.43 percentage points compared to NO3–. To our knowledge, this is the first report in field studies regarding the effect of Cl– on FHB. There is literature reporting Cl– increasing plant resistance to diseases, in which large amounts of Cl– were required (Chen et al. 2010). Although a number of studies have distinguished the effects of Cl– from the other accompanying cations (e.g. K+), the mechanism of Cl– effect on plant resistance to diseases is largely unkown (Marschner 2012).
The effect of N sources of fertilizer on FHB severity was not observed in this study. This finding is in accordance with Lemmens et al. (2004), who verified that the source of N had poor (< 1.9 percentage points) or no effects on FHB diseased spikelet. However, within a specific source of fertilizer (ammonium-nitrate-urea solution), the percentage of diseased spikelets increased from 2.2% at zero N rate, up to 6.1% at 160 kg ha-1 N.
We expected that N fertilizers containing NO3– could increase plant resistance to WB and FHB, when compared to those based on NH4+, but this was not confirmed. Mur et al. (2016) reported that the exogenous application o N fertilizers can shift the balance in favor of the host or pathogen, and the use of NO3– or NH4+ fertilizers affects the outcome of plant-pathogen interactions. They reported that NO3– augments plant resistance, while NH4+ can compromise host defense. Metabolically, NO3– increases production of polyamines (e.g. spermine and spermidine), which are established defense signals, and NH4+ augments γ-aminobutyric acid (GABA) levels, which may be a nutrient source for the pathogen.
The authors highlight the importance of comparing the two experiments (N and K sources of fertilizers) in the WB epidemic year of 2015 (Tables 1 and 2), because there was lower WB severity in the experiment with sources of K (average severity of 9.2%) ─ which received 60 kg ha-1 K2O)─ than in the experiment with sources of N (average severity of 19.1%) ─ which received 30 kg ha-1 K2O. Therefore, it can be deduced that there was a positive response of the wheat genotypes to K fertilization decreasing WB, showing the importance of working on other nutritional hypothesis, which encourages others researchers to do that.
Phenological stages for N and K fertilizations affecting WB and FHB. There was a significant effect of the phenological stage for topdressing fertilization only for N on FHB severity. However, the benefit of applying N earlier (on booting stage) was of low magnitude; this is because there was an FHB severity reduction of only 0.4 percentage points in the 2016 crop season. Therefore, considering that this season was not epidemic for FHB, further studies are needed to clarify this subject. Moreover, no reports were found in the literature about the effects of phenological stages for N and K fertilizations on WB and FHB diseases.
Weather influence on wheat expression to WB and FHB. Wheat expression to WB and FHB is mainly determined by weather conditions, since these head diseases require specific combination of moisture and temperature for pathogen reproduction and development, as well as for inoculum dispersion and infection. Kohli et al. (2011) reported that WB is usually expressed in seasons with successive days of continuous rains and average temperatures varying from 18 to 25 °C during the flowering stage, followed by hot and humid days. In turn, FHB requires similar conditions for disease development [warm humid weather at anthesis: 15 to 30 °C (optimal around 25 °C) and >20 h of rainfall or dew (relative humidity >90%)], despite its inoculum (F. graminearum perithecial and ascospore) is generally produced at 25 to 28 °C, and ascospore release occurs over a range of temperatures (10─30 °C) with optimal around 16 °C (Doohan et al. 2003, Xu 2003).
In our study, 2015 crop season was favorable to WB, due to an extended period of rainfall (76th to 93rd days at the growth season) after heading stage, combined with average temperature of 17 °C (12.4─23.1 °C) (Figure 1a). On the contrary, in 2016 crop season there were unsatisfactory amount of rainfall after the heading stage for WB expression, despite the average temperature was similar to that in the precedent crop season (Figures 1a and 1b).
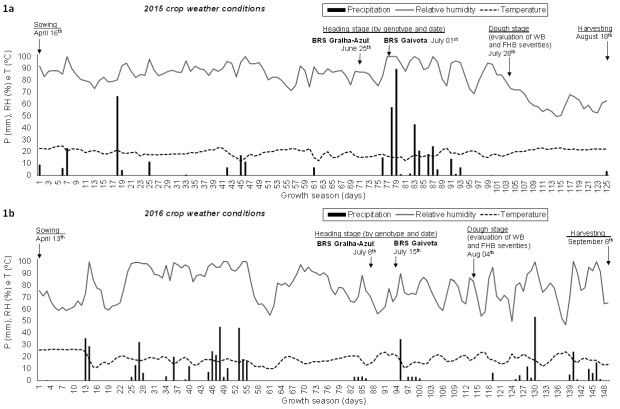
Figure 1. Precipitation (P), relative humidity (RH) and mean temperature (T) in the wheat crop seasons of 2015 (April 16th to August 18th = 125 days; Figure 1a) and 2016 (April 13th to September 8th = 149 days; Figure 1b) in Londrina (Brazil). WB = wheat blast. FHB = Fusarium head blight.
FHB severities were null or very low (average of 0.57%) in 2015 and 2016 crop seasons, respectively, regardless of the weather conditions could have been favorable to pathogen infection and development in the first season (Figure 1a). The authors hypothesize that there were unfavorable weather conditions for inoculum production and release in both crop seasons, because there were extended drought periods before anthesis (>24 and 32 days in 2015 and 2016 crop seasons, respectively) with relative humidity predominantly below 90%, which resulted in low disease pressure (Figures 1a and 1b). Besides, in 2016 crop season the weather condition was unfavorable to ascospore germination and infection in wheat flowers, because the relative humidity was below 90% at least in the three weeks that followed the heading and flowering stages (Figure 1b). Schmale and Bergstrom (2003) reported that FHB infection is benefited by extended periods of high moisture or relative humidity (>90%) and moderately warm temperatures (15─30°C), and when these weather conditions are present before, during and after flowering, favoring inoculum production, floret infection and colonization of developing grains. According to Lu et al. (2001), F. graminearum ascospore germination is critically affected by temperature and moisture, as described ahead: at 25 °C and 100% of relative humidity, germination was as high as 97.5% after 8 h, and incidence of infection on stamens was about 58% after 20 h; however, below 90% of relative humidity the germination was only about 0.4%.
Xu (2003) working with disease forecasting system for FHB, reported that the models include the effects of weather variables on two aspects of epidemic development: i) spore production, which requires sufficient rainfall about 8─10 days prior to and during anthesis, to improve production of ascospore and conidia; ii) spore dispersal and infection, which demand enough rainfall to disperse ascospores and/or conidia, followed by prolonged periods of warm humid conditions that are conducive for infection of spikes. On the other hand, Fernandes et al. (2017) reported in their study about weather-based model for predicting WB inoculum and infection that persistent rainy and warm conditions may warrant pathogen survival during spring and summer seasons in the form of conidia and mycelia on seed, wheat volunteers, plant debris, grass weed and cultivated species. Thus, the WB infection-based models have to include a combination of weather events at both, pre- and within-season, which affect inoculum build-up, spread and infection.
Based on the previous discussion, it is evident the importance of “escape strategy” to improve disease control. According to Wegulo et al. (2015), sowing several wheat cultivars with distinct flowering dates can result in some of the cultivars escaping infections, depending on the timing of occurrence of weather conditions favorable for infection.
It is concluded that N and K sources of fertilizers, and the phenological stages for N and K fertilizations, did not play an important role on wheat expression to WB and FHB. Therefore, the farmers can prioritize economic aspects in the choice of these fertilizers, which can be applied at different stages of wheat development. Weather condition was the determining factor in the wheat expression to WB and FHB, followed by genotype resistance. Thus, the best approach to manage these spike diseases is employing an integrated management program that use a combination of different methods of disease control. For this, the authors highlight the value of using wheat genotypes more resistant to these diseases, as well as adopting strategies to escape from the favorable environmental conditions for pathogen reproduction, inoculum dispersion and infection on spikes. Among these strategies, it is suggested: sowing (on the same date) several wheat genotypes with different flowering dates; and/or sowing a single genotype in several dates (spaced at least 10 days apart).
Acknowledgements
This research was supported by Brazilian Agricultural Research Corporation (Embrapa), Agricultural Research Institute of Paraná (IAPAR), and Fundação Meridional de Apoio à Pesquisa Agropecuária. We are thankful to Fernando Portugal, Milton Dalbosco, Leandro Borsato and Márcio Nunes for their valuable technical assistance; we also thank the researchers João Leodato Maciel, José França Neto and Yeshwant Mehta for their contributions in earlier versions of the manuscript.
References
- Amtmann A et al. 2008. The effect of potassium nutrition on pest and disease resistance in plants. Physiologia Plantarum 133:682–691.
- Bassoi MC et al. 2016. Cultivares de trigo e triticale – Embrapa e Iapar. Londrina, Brazil: Embrapa Soja.
- Blandino M et al. 2012. Integrated strategies for the control of Fusarium head blight and deoxynivalenol contamination in winter wheat. Field Crops Research 133:139–149.
- Cao P et al. 2018. Historical nitrogen fertilizer use in agricultural ecosystem of the contiguous United States during 1850–2015: Application rate, timing, and fertilizer types. Earth System Science Data 10:969–984.
- Chen W et al. 2010. Chlorine nutrition of higher plants: Progress and perspectives. Journal of Plant Nutrition 33:943–952.
- Cruz CD. 2013. GENES – a software package for analysis in experimental statistics and quantitative genetics. Acta Scientiarum. Agronomy 35:271–276.
- Cruz CD and Valent B. 2017. Wheat blast disease: danger on the move. Tropical Plant Pathology 42:210–222.
- Cunha GR and Caierão E. 2014. Informações técnicas para trigo e triticale – Safra 2015. Brasília, Brazil: Embrapa.
- Del Ponte EM et al. 2017. A special issue on Fusarium head blight and wheat blast. Tropical Plant Pathology 42:143–145.
- Doohan FM et al. 2003. Influence of climatic factors on Fusarium species pathogenic to cereals. European Journal of Plant Pathology 109:755–768.
- Dweba CC et al. 2017. Fusarium head blight of wheat: Pathogenesis and control strategies. Crop Protection 91:114–122.
- Fernandes JMC et al. 2017. A weather-based model for predicting early season inoculum build-up and spike infection by wheat blast pathogen. Tropical Plant Pathology 42:230–237.
- Goswami RS and Kistler HC. 2004. Heading for disaster: Fusarium graminearum on cereal crops. Molecular Plant Pathology 5:515–525.
- Ha X et al. 2016. Wheat blast and Fusarium head blight display contrasting interaction patterns on ears of wheat genotypes differing in resistance. Phytopathology 106:270–281.
- Hirel B et al. 2011. Improving nitrogen use efficiency in crops for sustainable agriculture. Sustainability 3:1452–1485.
- Hofer K et al. 2016. Effect of nitrogen fertilization on Fusarium head blight in spring barley. Crop Protection 88:18–27.
- Igarashi S et al. 1986. Pyricularia em trigo. 1. Ocorrência de Pyricularia sp. no estado do Paraná. Fitopatologia Brasileira 11:351–352.
- Kant S et al. 2011. Understanding plant response to nitrogen limitation for the improvement of crop nitrogen use efficiency. Journal of Experimental Botany 62:1499–1509.
- Kohli M.M et al 2011. Pyricularia blast – a threat to wheat cultivation. Czech Journal of Genetics and Plant Breeding 47:130–134.
- Krnjaja V et al. 2015. Influence of N-fertilization on Fusarium head blight and micotoxin levels in winter wheat. Crop Protection 67:251–256.
- Lemmens M et al. 2004. The effect of nitrogen fertilization on Fusarium head blight development and deoxynivalenol contamination in wheat. Journal of Phytopathology 152:1–8.
- Lu WH et al. 2001. Research on Fusarium Head scab. Beijing, China: Science Publisher.
- Maciel JLN. 2011. Magnaporthe oryzae, the blast pathogen: Current status and options for its control. CAB Reviews: Perspectives in Agriculture, Veterinary Science, Nutrition and Natural Resources 6:1–8.
- Maciel JLN et al. 2013. Diagrammatic scale for the assessment of blast on wheat spikes. Summa Phytopathologica 39:162–166.
- Marschner P. 2012. Marschner’s mineral nutrition of higher plants. 3rd ed. Amsterdam, Netherlands: Elsevier/Academic Press.
- Mur LAJ et al. 2016. Moving nitrogen to the centre of plant defence against pathogens. Annals of Botany 119:703–709.
- Osuna-Canizalez FJ et al. 1991. Nitrogen form and silicon nutrition effects on resistance to blast disease of rice. Plant and Soil 135:223–231.
- Pagani APS et al. 2014. Management of wheat blast with synthetic fungicides, partial resistance and silicate and phosphito minerals. Phytoparasitica 42:609–617.
- Paul PA et al. 2005. Relationships between incidence and severity of Fusarium head blight on winter wheat in Ohio. Phytopathology 95:1049–1060.
- Robertson GP and Vitousek PM. 2009. Nitrogen in agriculture: Balancing the cost of an essential resource. Annual Review of Environment and Resources 34:97–125.
- Rodrigues FA et al. 2017. Pyricularia oryzae-wheat interaction: Physiological changes and disease management using mineral nutrition and fungicides. Tropical Plant Pathology 42:223−229.
- Santos HG et al. 2013. Sistema brasileiro de classificação de solos. 3rd Ed. Brasília, Brazil: Embrapa Informação Tecnológica.
- Schmale III DG and Bergstrom GC. 2003. Fusarium head blight. The Plant Health Instructor, http://dx.doi.org/10.1094/PHI-I-2003-0612-01.
- Silva SR. et al. 2019. Nitrogen fertilization effects on wheat blast epidemics under varying field environmental conditions. Tropical Plant Pathology 44:258–267.
- Stack RW and McMullen MP. 1995. A visual scale to estimate severity of Fusarium head blight in wheat. Extension Publication PP-1095. Fargo: North Dakota State University Extension Service.
- Tavernier V et al. 2007. The plant nitrogen mobilization promoted by Colletotrichum lindemuthianum in Phaseolus leaves depends on fungus pathogenicity. Journal of Experimental Botany 58:3351–3360.
- van der Lee T. et al. 2015. Biogeography of Fusarium graminearum species complex and chemotypes: a review. Food Additives & Contaminants: Part A 32:453−460.
- Veresoglou SD et al. 2013. Fertilization affects severity of disease caused by fungal plant pathogens. Plant Pathology 62:961–969.
- Xu X. 2003. Effects of environmental conditions on the development of Fusarium ear blight. European Journal of Plant Pathology 109:683–689.
- Wang M et al. 2013. The critical role of potassium in plant stress response. International Journal of Molecular Sciences 14:7370–7390.
- Wegulo SN et al. 2015. Management of Fusarium head blight of wheat and barley. Crop Protection 73:100–107.
- Yang F et al. 2010. Investigation of the effect of nitrogen on severity of Fusarium head blight in barley. Journal of Proteomics 73:743–752.
- Yoshida M et al. 2008. Effect of nitrogen application at anthesis on Fusarium head blight and mycotoxin accumulation in breadmaking wheat in the western part of Japan. Journal of General Plant Pathology 74:355–363.
- Zadoks JC et al. 1974. A decimal code for the growth stages of cereals. Weed Research 14:415−421.
- Zörb C et al. 2014. Potassium in agriculture ─ Status and perspectives. Journal of Plant Physiology 171:656–669.
